Projects
The work I have below is arranged by creation date from most recent to least recent.
2026
Deep Learning for Digital Pathology: Tumor Detection Using the PCam Dataset
Written and submitted on March 20, 2026 (Link)
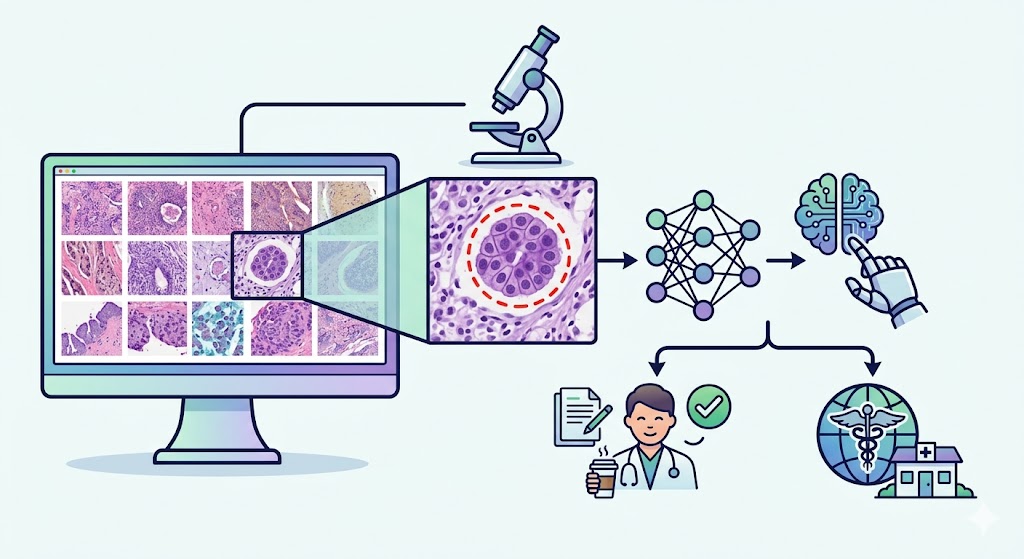
This project was written and done in collaboration with UW ECE graduate student Simon Zou as the final project for CSE 527: Computation Biology - Explainable AI in Biology & Biomedicine by Professor Su-In Lee during the Winter 2026 quarter. Accurate identification of metastatic tissue is critical for cancer diagnosis, yet healthcare systems face a severe shortage of pathologists. To address this bottleneck, our paper focused on automating tumor detection in histopathological images using deep learning architectures. The study evaluated a custom convolutional neural network against a baseline equivariant model and a pre-trained residual network. While all models achieved high diagnostic accuracy and the fine-tuned residual network with data augmentation attained the highest overall accuracy, the custom model demonstrated vastly superior computational efficiency. Additionally, interpretability analyses showed that the custom model relied on highly localized, granular cellular structures to make its predictions, whereas the pre-trained networks focused on broader spatial features. These findings indicate that lightweight, interpretable, and purpose-built diagnostic tools can perform competitively with deeper networks, offering an efficient triage solution to alleviate clinical workloads without compromising patient safety.
- This paper was also presented as a poster in the course’s own poster session on March 12, 2026. The poster can be found below or accessed through this link.

2025
The Impact of Client Balance and Credit Default on Term Deposit Subscription, Controlling for Socioeconomic Factors
Written and submitted on December 9, 2025 (Link)

This paper was written in collaboration with another fellow MS Statistics student Alison Wong (LinkedIn, GitHub) as the final project paper for BIOST 531: Statistical Methods for Analysis with Missing Data by Professor Katie Wilson during the Autumn 2025 quarter. This study analyzes the Bank Marketing dataset from a Portuguese banking institution to quantify the effects of average yearly balance and credit default on term deposit subscription while controlling for missing socioeconomic data. Assuming a Missing at Random (MAR) mechanism based on observed data patterns, we utilized Complete Case (CC) analysis, Bayesian likelihood, and Multiple Imputation (MI) methods to handle missing data inside the dataset. We found that higher balances significantly increased subscription odds (~26% per 10,000 Euros), while credit default reduced them (~38–41%). Notably, CC analysis overestimated the negative effect of default compared to the other two methods, hinting at potential bias from using CC analysis.
Evaluation of Imputation Methods Under Different Missing Data Conditions
Written and submitted on June 9, 2025 (Link)

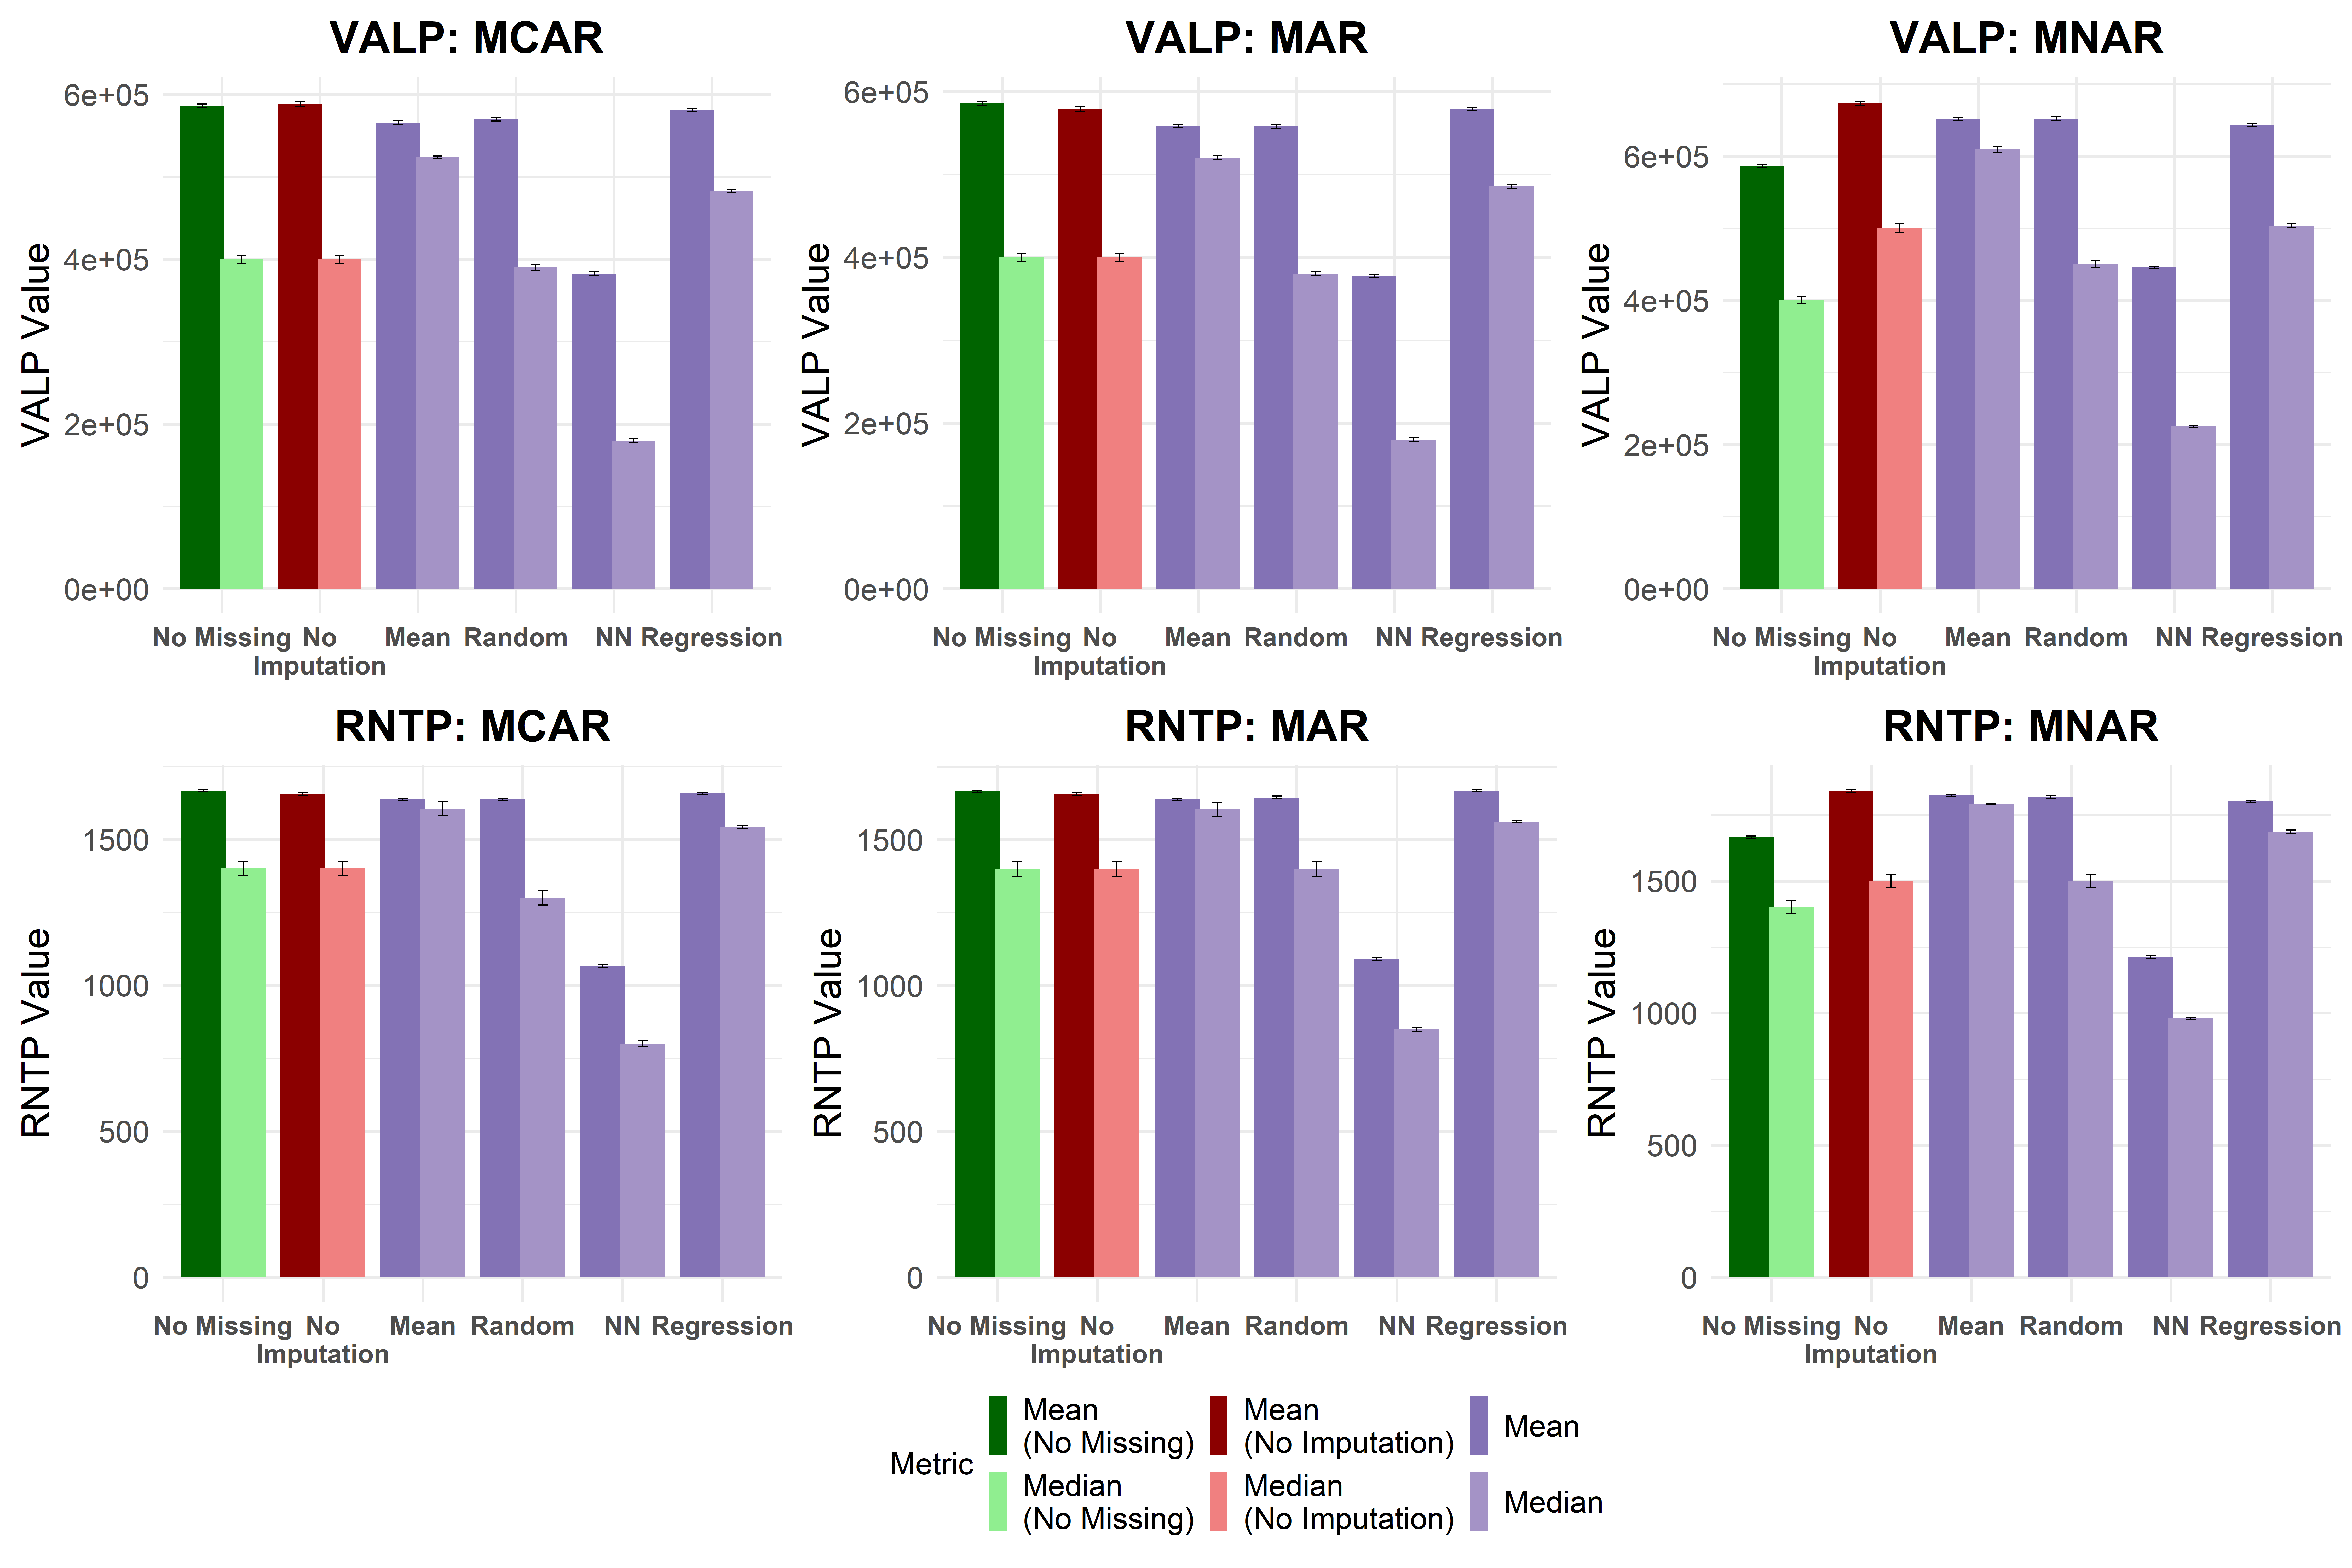
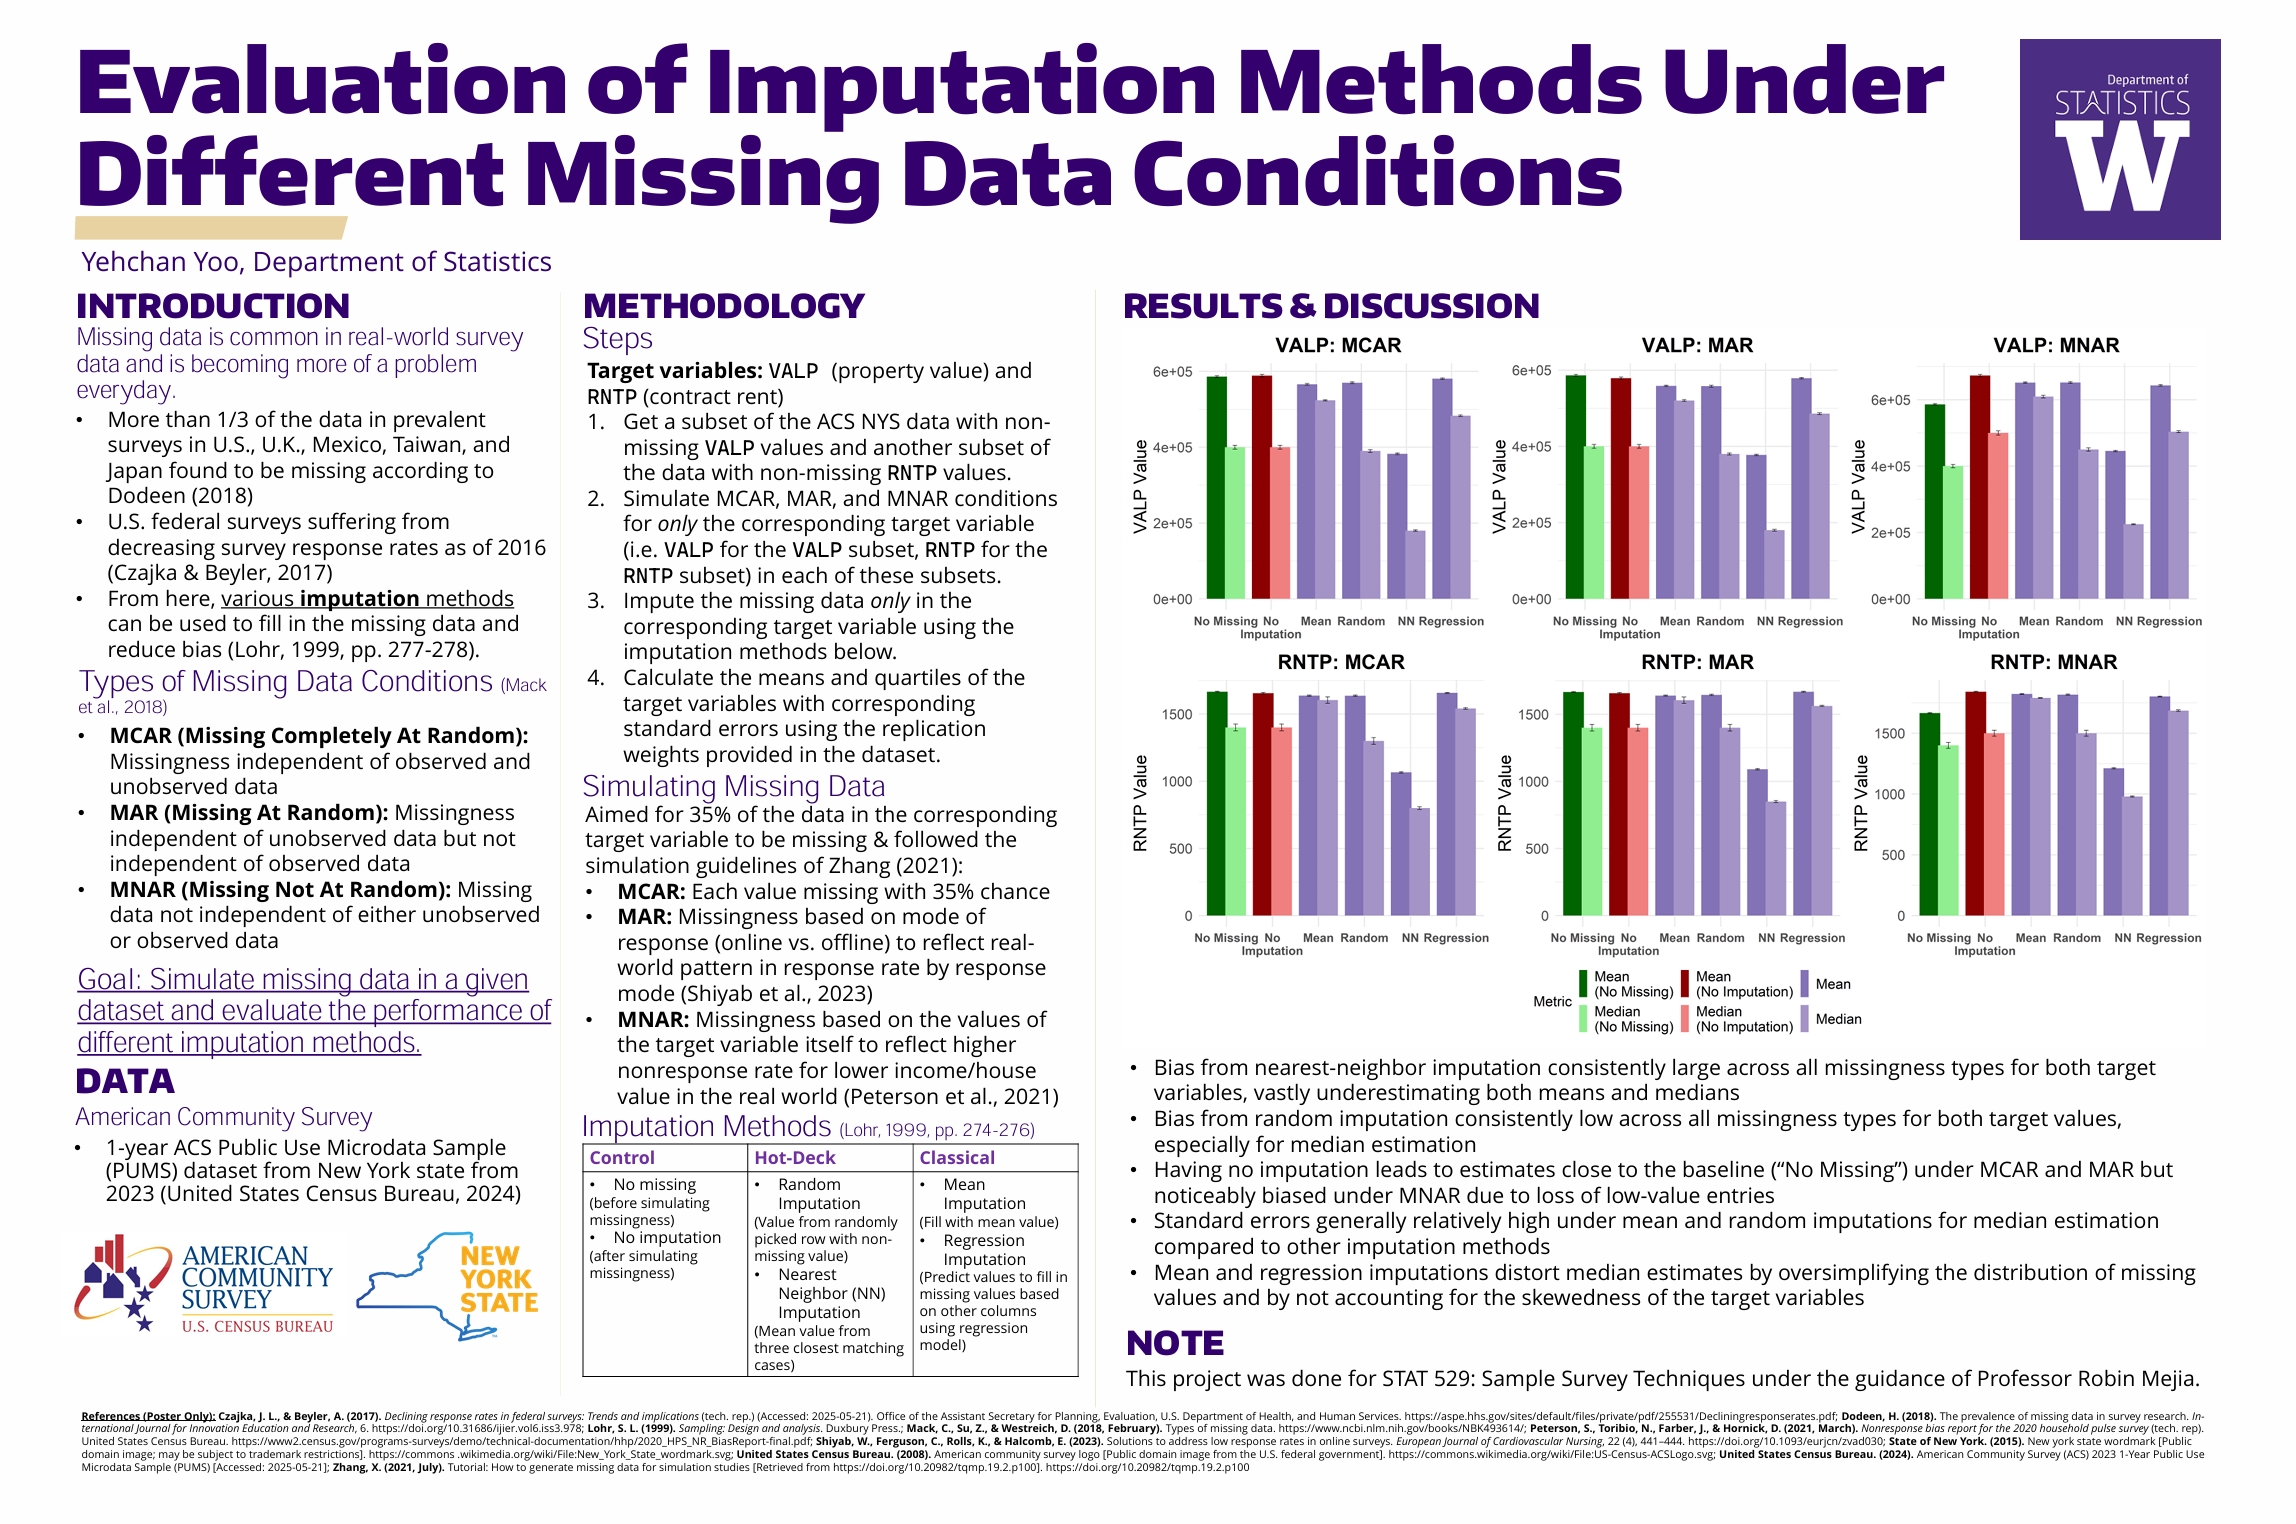
This paper was written as the final project paper for STAT 529: Sample Survey Techniques by Professor Robin Mejia during my time at University of Washington. This paper simulates how different imputation methods perform under three missing data conditions —- MCAR, MAR, and MNAR —- for two variables RNTP (rent price) and VALP (property value) in the 1-year 2023 ACS Public Use Microdata Sample for New York State. For each missing data condition, the study applies five imputation approaches: no imputation, mean, random, nearest neighbor, and regression. The study found that random imputation yields the best quartile estimates under MNAR, while mean and regression methods perform better for means but distort quantiles. Nearest neighbor is the least effective, being slow and highly biased.
- This paper was also presented as a poster in the Spring CSSS Poster Session on June 9, 2025. The poster can be found below or accessed through this link.
Replication of Rec-R1
Written and submitted on June 6, 2025 (Link, Github Repo)

 |
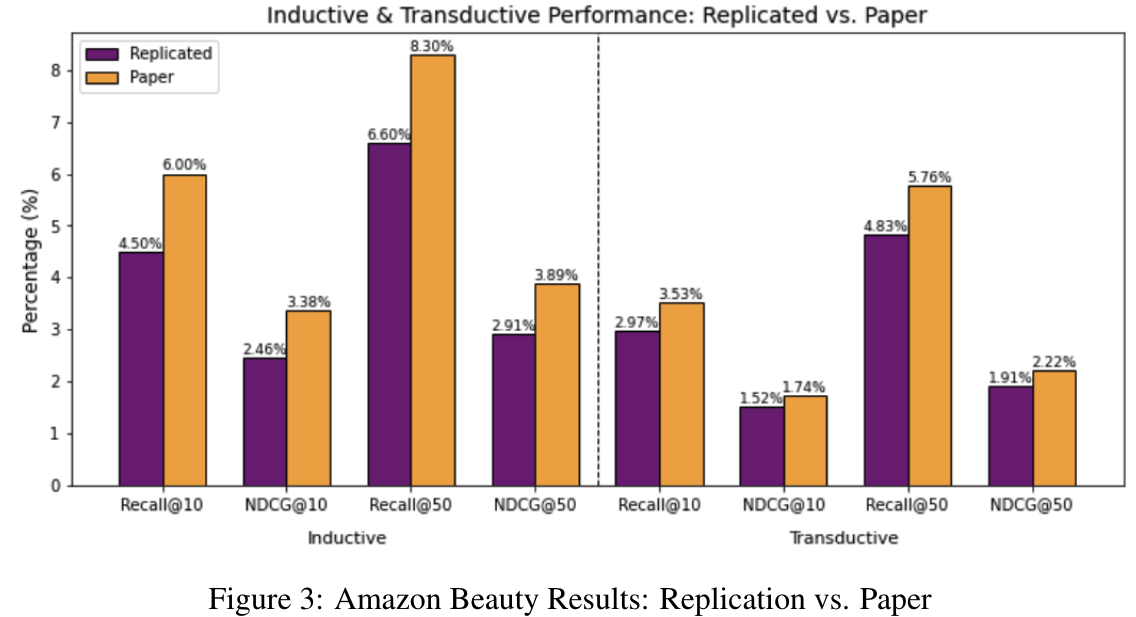 |
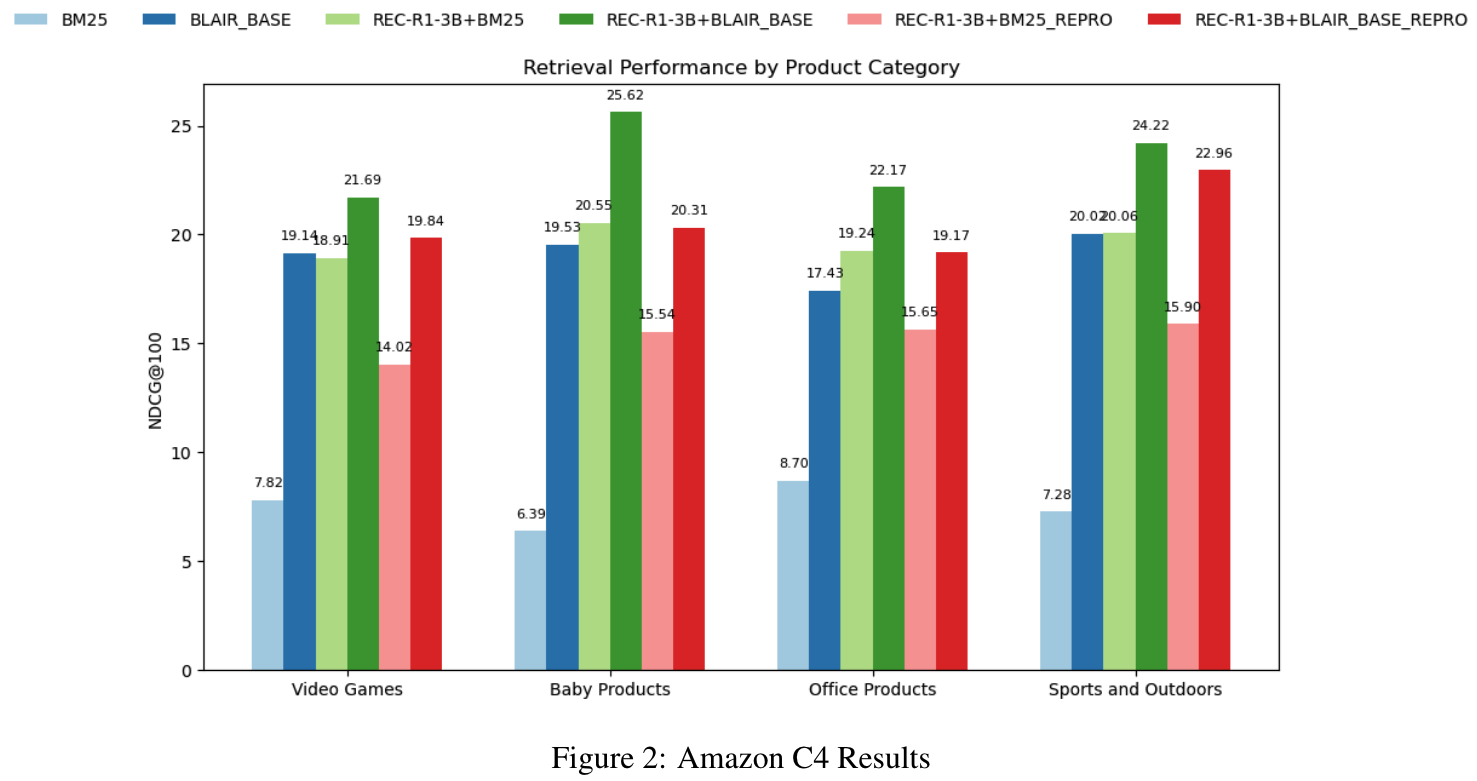
This paper was written in collaboration with my classmates Justin Chae, Johan Lindqvist, and Thomas Lilly as the final project paper for CSE 493S/599S: Advanced Machine Learning in University of Washington, taught by Professor Sewoong Oh. This project aimed to replicate the results of the Rec-R1 paper, which proposes a reinforcement learning framework combining large language models (LLMs) with recommendation systems. Using publicly available code and datasets, my teammates and I verified that Rec-R1 improved model performance across several tasks, including product search and sequential recommendation, and preserved general-purpose reasoning capabilities better than supervised fine-tuning. However, they could not reproduce the paper’s claims of computational efficiency due to limited access to high-memory GPUs and encountered significant issues with poorly documented code. Despite these challenges, the project confirmed Rec-R1’s performance benefits and highlighted the need for better resource access and code maintenance for reproducibility.
2023
Inference and Prediction on Crude Diabetes Prevalence in U.S. States Based on Vegetable Consumption
Last updated on May 12, 2023 (Link)
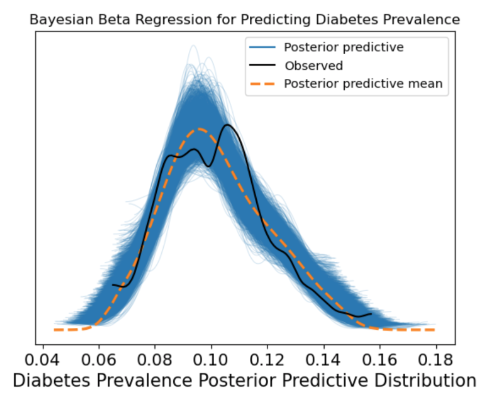
This paper was written in collaboration with my classmates Christina Đặng, Conan Minihan, and Tetsuro Escudero as the final project report for DATA 102: Data, Inference, and Decisions, taught by Mr. Ramesh Sridharan and Professor Eaman Jahani for the Spring 2023 semester. This paper uses inferential and predictive techniques to examine the relationship between vegetable consumption and crude diabetes prevalence in American states and predict diabetes prevalence based on vegetable consumption.
2022
Replication and Improvement on “How do 401(k)s Affect Saving? Evidence from Change in 401(k) Eligibility”
Last updated on December 16, 2022 (Link)
This paper was written in collaboration with my classmate Xinyi Zi as the final project paper for STAT 156: Causal Inference, taught by Professor Peng Ding for the Fall 2022 semester. This paper attempts to explore, replicate, critique, and re-do Professor Alexander M. Gelber’s 2011 causal inference paper “How Do 401(k)s Affect Saving? Evidence from Changes in 401(k) Eligibility”.
- Video presentation: https://www.youtube.com/watch?v=Tpw7Ch7XJDg&feature=youtu.be&ab_channel=XinyiZi
2019
SAAS x Trace Data
Last updated on December 13, 2019 (Link)
During the Fall 2019 semester, as a member of the Data Consulting committee in the Student Association for Applied Statistics (SAAS), I worked in a team to create our own JSON key-value pair classification systems using machine learning and natural language processing models with data provided by a startup named Trace Data (later acquired by Netskope). More specifically, I worked with Amal Bhatnagar to create an unsupervised clustering algorithm using tf-idf as the main metric.
2018
Meaning of Probabilities in Social Sciences
Last updated on July 13, 2025; originally written during the Fall 2018 semester (Link)
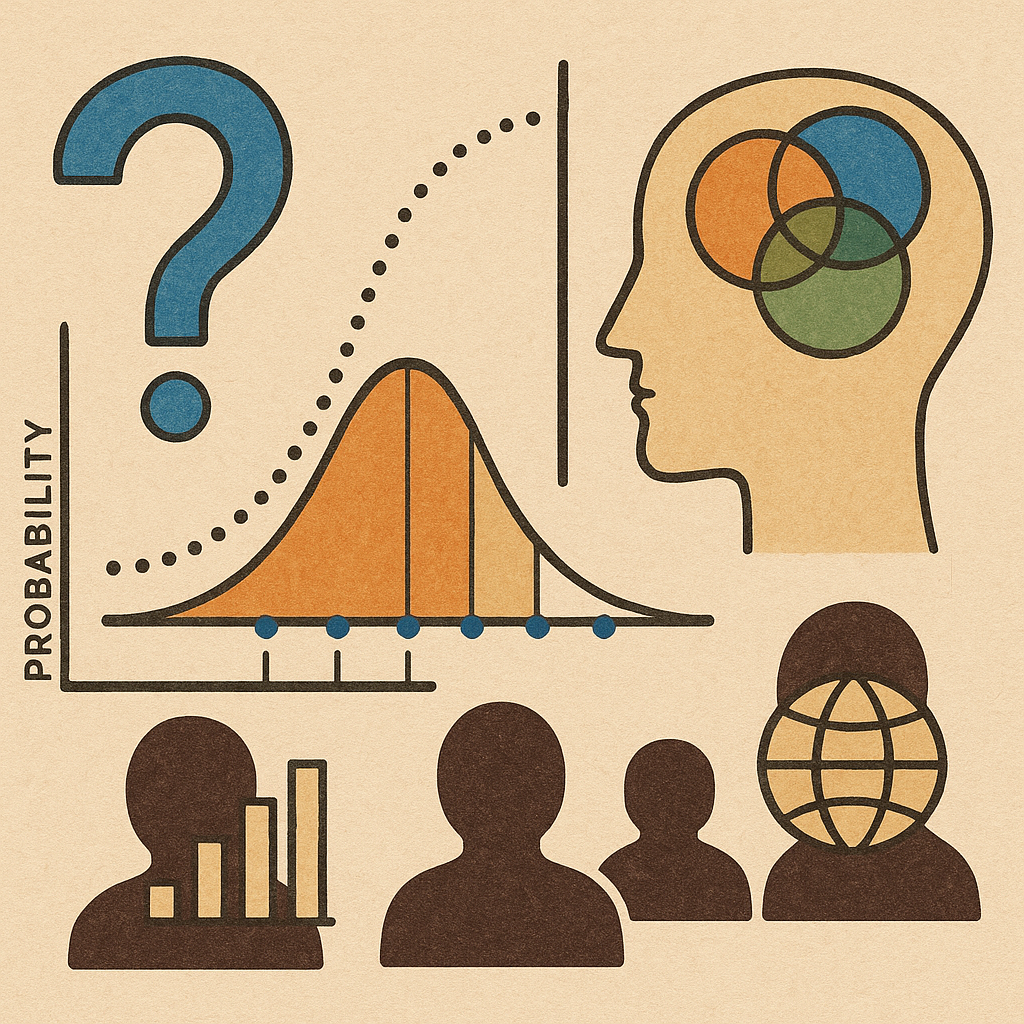
As a declared Statistics major interested in social sciences, I often found that probability was used a lot in social science research. But I often wondered: what do these probabilities fundamentally mean? I wrote an article on the meaning of probabilities in social sciences to help answer this question during my time as a member of the Research and Publication Committee in Statistics Undergraduate Student Association (now called SAAS or Student Association for Applied Statistics).
Analyzing Undergraduate Statistics Majors’ Preparation in Communication with Non-Statisticians in the University of California, Berkeley
Last updated on May 9, 2018 (Link)

Assessing the preparation of undergraduate statistics majors in statistical writing for non-statisticians at the University of California, Berkeley, revealed a significant gap. Despite substantial training in statistical writing within major classes, students lacked practical experience communicating with non-statisticians. Interviews with professors indicated a hesitancy to enforce stricter writing requirements, citing resource constraints and a desire for program growth. However, the findings underscored the pressing need for increased resources devoted to statistical writing education within the Department of Statistics. This project was written for my final project for the COLWRIT R4B class on discourse conventions in various academic fields.
Is there a statistical relationship between a region’s legalization of euthanasia and that region’s suicide rate?
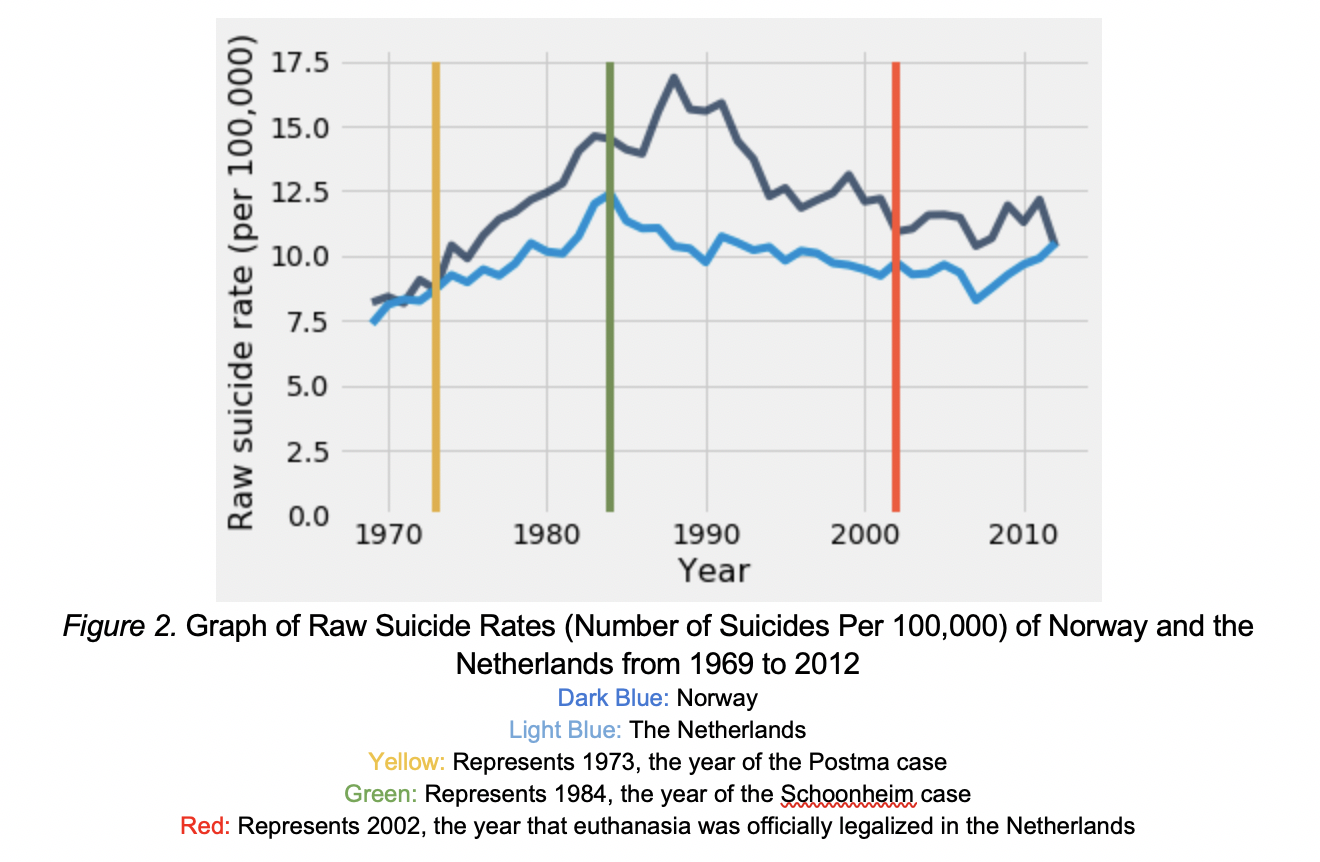
Last updated on May 1, 2018 (Link)
Statistical analysis of data from Mexico indicates that the legalization of passive euthanasia in certain Mexican regions likely is unrelated to the Mexican regions’ raw suicide rates in the short run. Difference-in-difference analysis on data from the Netherlands (and Norway) indicates that, while major events towards the legalization of active and passive euthanasia may have had a decreasing short-run impact on the raw suicide rate of the Netherlands, such effect – if present – likely became diluted over time. This research article was written during my time as a member of the Research and Publication Committee in Statistics Undergraduate Student Association (now called SAAS or Student Association for Applied Statistics).