
Projects: Before Graduate School (Before 2024)
The projects below were completed before graduate school (before 2024) and are arranged in reverse chronological order (from most recent to least recent). For more recent projects, see Graduate School (After 2024).
2023
Inference and Prediction on Crude Diabetes Prevalence in U.S. States Based on Vegetable Consumption
Written and submitted on May 12, 2023 (Link)
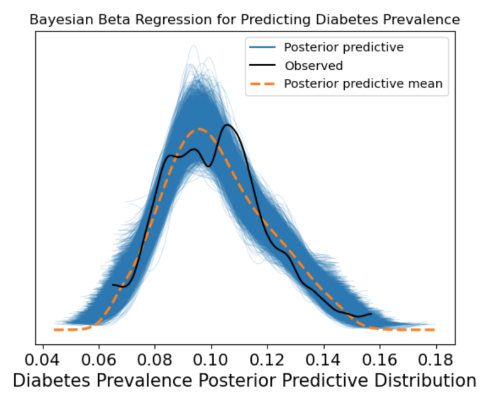
This paper was written in collaboration with my classmates Christina Đặng, Conan Minihan, and Tetsuro Escudero as the final project report for DATA 102: Data, Inference, and Decisions, taught by Mr. Ramesh Sridharan and Professor Eaman Jahani for the Spring 2023 semester. This paper uses inferential and predictive techniques to examine the relationship between vegetable consumption and crude diabetes prevalence in American states and predict diabetes prevalence based on vegetable consumption.
2022
Replication and Improvement on “How do 401(k)s Affect Saving? Evidence from Change in 401(k) Eligibility”
Written and submitted on December 16, 2022 (Link)
This paper was written in collaboration with my classmate Xinyi Zi as the final project paper for STAT 156: Causal Inference, taught by Professor Peng Ding for the Fall 2022 semester. This paper attempts to explore, replicate, critique, and re-do Professor Alexander M. Gelber’s 2011 causal inference paper “How Do 401(k)s Affect Saving? Evidence from Changes in 401(k) Eligibility”.
- Video presentation: https://www.youtube.com/watch?v=Tpw7Ch7XJDg&feature=youtu.be&ab_channel=XinyiZi
2018
Meaning of Probabilities in Social Sciences
Last updated on July 13, 2025; originally written during the Fall 2018 semester (Link)
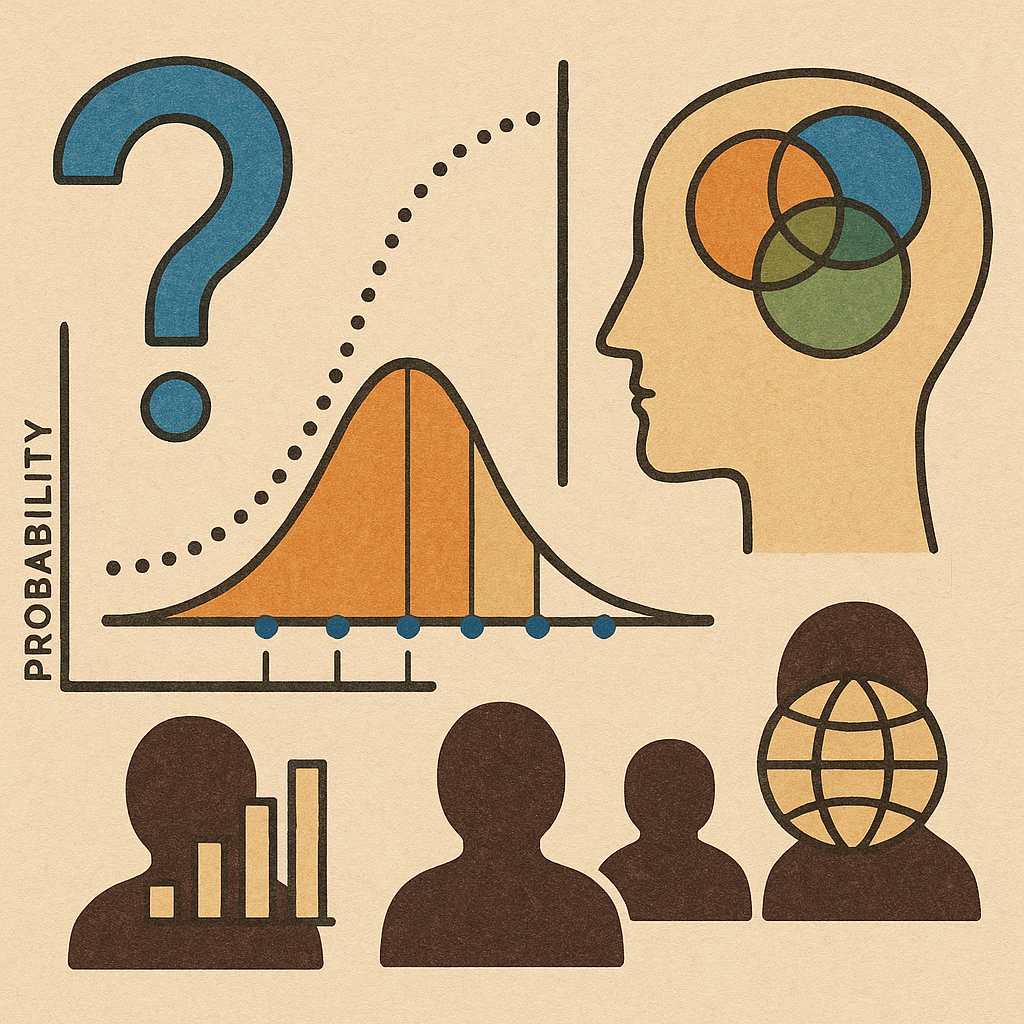
As a declared Statistics major interested in social sciences, I often found that probability was used a lot in social science research. But I often wondered: what do these probabilities fundamentally mean? I wrote an article on the meaning of probabilities in social sciences to help answer this question during my time as a member of the Research and Publication Committee in Statistics Undergraduate Student Association (now called SAAS or Student Association for Applied Statistics).
Analyzing Undergraduate Statistics Majors’ Preparation in Communication with Non-Statisticians in the University of California, Berkeley
Written and submitted on May 9, 2018 (Link)

Assessing the preparation of undergraduate statistics majors in statistical writing for non-statisticians at the University of California, Berkeley, revealed a significant gap. Despite substantial training in statistical writing within major classes, students lacked practical experience communicating with non-statisticians. Interviews with professors indicated a hesitancy to enforce stricter writing requirements, citing resource constraints and a desire for program growth. However, the findings underscored the pressing need for increased resources devoted to statistical writing education within the Department of Statistics. This project was written for my final project for the COLWRIT R4B class on discourse conventions in various academic fields.
Is there a statistical relationship between a region’s legalization of euthanasia and that region’s suicide rate?
Written and submitted on May 1, 2018 (Link)
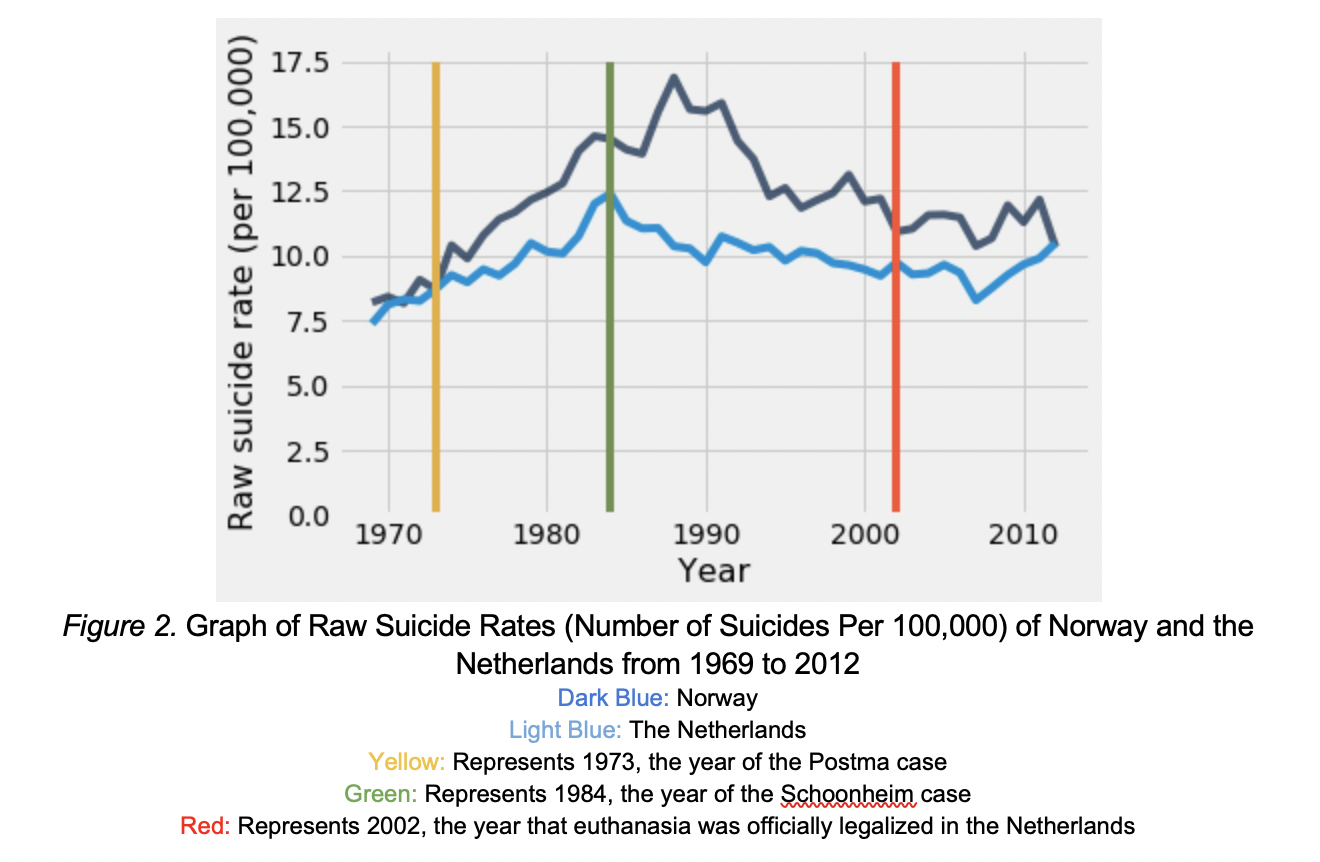
Statistical analysis of data from Mexico indicates that the legalization of passive euthanasia in certain Mexican regions likely is unrelated to the Mexican regions’ raw suicide rates in the short run. Difference-in-difference analysis on data from the Netherlands (and Norway) indicates that, while major events towards the legalization of active and passive euthanasia may have had a decreasing short-run impact on the raw suicide rate of the Netherlands, such effect – if present – likely became diluted over time. This research article was written during my time as a member of the Research and Publication Committee in Statistics Undergraduate Student Association (now called SAAS or Student Association for Applied Statistics).
Pre-College
Interactive GeoGebra Proofs
 |
 |
During middle and high school, I created interactive GeoGebra proofs to add interactivity to regular geometry texts I saw for better understanding of geometry materials. These proofs involve the use of step-by-step animations and colored labels for clear visualization. The proofs also allow users to manipulate geometric elements and see how the proofs hold up across different configurations. As of November 15, 2026, they have gathered over 27,000 views overall.
- Yehchan’s GeoGebra profile webpage: https://www.geogebra.org/u/focicle2020